Reproducible manuscripts with Quarto

R
quarto
R-SIG
R-SIG 15.07.2024
Published

July 15, 2024

1

Introduction

Quarto is an open-source scientific and technical publishing system. It allows us to combine code and markdown text to produce reproducible manuscripts that can automatically incorporate and evaluate our code when rendering. We can also build slides and even websites (like the one you are currently on).

Components

YAML header

Quarto documents have the ending .qmd.

The YAML header, which begins on the top of the document with ---, and also ends with ---, contains global options for the document:

---
title: "Reproducible manuscripts with Quarto"
description: "R-SIG 15.07.2024"
author: 
  - name: Nicklas Hafiz
  - affiliation: PhD student at the IQB, Methods team
categories: [R, quarto]
date: 07-15-2024
bibliography: references.bib
csl: apa7.csl
format: pdf
---

An overview of possible YAML-fields can be found here.
Note the format field, which lets us quickly convert our document between pdf, word and html, and also lets us use one of many templates.

Markdown text

The body of the document is written in markdown language. Some expressions:

  • # for headers. Add as many # as you like for subheaders.
  • **bold**: bold
  • *italic*: italic
  • ``code\
  • Lists: - for bullet points, 1. for numbered lists (beware: the line above the list has to be empty)
  • Linebreaks: Two spaces at the end of a line.
  • Links: [text](url)

Code chunks

We can run code in different languages (like R, Julia, Python …) directly from our Quarto-file. In RStudio you can press Strg-Alt-i to insert a new r code chunk.

library(tidyverse)
── Attaching core tidyverse packages ──────────────────────── tidyverse 2.0.0 ──
✔ dplyr     1.1.4     ✔ readr     2.1.5
✔ forcats   1.0.0     ✔ stringr   1.5.1
✔ ggplot2   3.5.1     ✔ tibble    3.2.1
✔ lubridate 1.9.3     ✔ tidyr     1.3.1
✔ purrr     1.0.2     
── Conflicts ────────────────────────────────────────── tidyverse_conflicts() ──
✖ dplyr::filter() masks stats::filter()
✖ dplyr::lag()    masks stats::lag()
ℹ Use the conflicted package (<http://conflicted.r-lib.org/>) to force all conflicts to become errors
athletes <- readRDS(file = here::here("raw_data", "athletes.rds"))
head(athletes)
  NOC     ID                  Name Sex Age Height Weight        Team
1 AFG 132181           Najam Yahya   M  NA     NA     NA Afghanistan
2 AFG  87371 Ahmad Jahan Nuristani   M  NA     NA     NA Afghanistan
3 AFG  44977     Mohammad Halilula   M  28    163     57 Afghanistan
4 AFG    502     Ahmad Shah Abouwi   M  NA     NA     NA Afghanistan
5 AFG 109153    Shakar Khan Shakar   M  24     NA     74 Afghanistan
6 AFG  29626  Sultan Mohammad Dost   M  28    168     73 Afghanistan
        Games Year Season      City     Sport
1 1956 Summer 1956 Summer Melbourne    Hockey
2 1948 Summer 1948 Summer    London    Hockey
3 1980 Summer 1980 Summer    Moskva Wrestling
4 1956 Summer 1956 Summer Melbourne    Hockey
5 1964 Summer 1964 Summer     Tokyo Wrestling
6 1960 Summer 1960 Summer      Roma Wrestling
                                    Event Medal      Region
1                     Hockey Men's Hockey  <NA> Afghanistan
2                     Hockey Men's Hockey  <NA> Afghanistan
3 Wrestling Men's Bantamweight, Freestyle  <NA> Afghanistan
4                     Hockey Men's Hockey  <NA> Afghanistan
5 Wrestling Men's Welterweight, Freestyle  <NA> Afghanistan
6 Wrestling Men's Welterweight, Freestyle  <NA> Afghanistan

We can tweak the code execution via different execution options, which are written on top of the chunk:

#| echo: false
#| message: false

library(tidyverse)
athletes <- readRDS(file = here::here(  "raw_data", "athletes.rds"))
head(athletes)

becomes:

  NOC     ID                  Name Sex Age Height Weight        Team
1 AFG 132181           Najam Yahya   M  NA     NA     NA Afghanistan
2 AFG  87371 Ahmad Jahan Nuristani   M  NA     NA     NA Afghanistan
3 AFG  44977     Mohammad Halilula   M  28    163     57 Afghanistan
4 AFG    502     Ahmad Shah Abouwi   M  NA     NA     NA Afghanistan
5 AFG 109153    Shakar Khan Shakar   M  24     NA     74 Afghanistan
6 AFG  29626  Sultan Mohammad Dost   M  28    168     73 Afghanistan
        Games Year Season      City     Sport
1 1956 Summer 1956 Summer Melbourne    Hockey
2 1948 Summer 1948 Summer    London    Hockey
3 1980 Summer 1980 Summer    Moskva Wrestling
4 1956 Summer 1956 Summer Melbourne    Hockey
5 1964 Summer 1964 Summer     Tokyo Wrestling
6 1960 Summer 1960 Summer      Roma Wrestling
                                    Event Medal      Region
1                     Hockey Men's Hockey  <NA> Afghanistan
2                     Hockey Men's Hockey  <NA> Afghanistan
3 Wrestling Men's Bantamweight, Freestyle  <NA> Afghanistan
4                     Hockey Men's Hockey  <NA> Afghanistan
5 Wrestling Men's Welterweight, Freestyle  <NA> Afghanistan
6 Wrestling Men's Welterweight, Freestyle  <NA> Afghanistan

We can also define global execution options for the whole ´.qmd´ file in the YAML header:

---
title: "Reproducible manuscripts with Quarto"
description: "R-SIG 15.07.2024"
author: 
  - name: Nicklas Hafiz
  - affiliation: PhD student at the IQB, Methods team
categories: [R, quarto]
date: 07-15-2024
bibliography: references.bib
csl: apa7.csl
format: pdf
execute:
  echo: false
  warning: false
  message: false
---

Tables

Tables can be a bit tricky. The great thing is: once you have styled them, they get updated automatically if some data changes. Also, there are a lot of different packages for building tables in markdown, here are some options:

Markdown

For some simple tables, the normal markdown syntax might be enough, see here.

| Column 1 | Column 2 | Column 3 |
|----------|----------|----------|
| A1       | B1       | C1       |
| A2       | B2       | C2       |
Column 1 Column 2 Column 3
A1 B1 C1
A2 B2 C2

Kable

With knitr::kable() you can build tables programmatically from code chunks:

judo_athletes_ger <- athletes %>%
  filter(Sport == "Judo", Region == "Germany", !is.na(Medal)) %>%
  select(Year, Name, Sex, Age, Height, Weight, Region, Medal) %>%
  arrange(Year, Sex)

knitr::kable(judo_athletes_ger)
Year Name Sex Age Height Weight Region Medal
1964 Wolfgang Hofmann M 23 177 80 Germany Silver
1964 Klaus Glahn M 22 187 101 Germany Bronze
1972 Paul Barth M 26 181 90 Germany Bronze
1972 Klaus Glahn M 30 187 101 Germany Silver
1972 Dietmar Htger M 25 172 70 Germany Bronze
1976 Gnther Neureuther M 20 186 95 Germany Silver
1980 Detlef Ultsch M 24 170 80 Germany Bronze
1980 Dietmar Lorenz M 30 180 93 Germany Gold
1980 Harald Heinke M 25 178 78 Germany Bronze
1980 Dietmar Lorenz M 30 180 93 Germany Bronze
1980 Karl-Heinz Lehmann M 23 169 71 Germany Bronze
1984 Frank Wieneke M 22 179 78 Germany Gold
1984 Arthur Schnabel M 35 182 104 Germany Bronze
1984 Gnther Neureuther M 28 186 95 Germany Bronze
1988 Frank Wieneke M 26 179 78 Germany Silver
1988 Marcus “Marc” Meiling M 26 194 95 Germany Silver
1988 Henry Sthr M 28 194 120 Germany Silver
1988 Sven Loll M 24 182 71 Germany Silver
1988 Torsten Brcht (Oehmigen-) M 24 178 78 Germany Bronze
1992 Richard Trautmann M 23 168 65 Germany Bronze
1992 Udo Gnther Quellmalz M 25 175 65 Germany Bronze
1996 Johanna Hagn F 23 168 NA Germany Bronze
1996 Udo Gnther Quellmalz M 29 175 65 Germany Gold
1996 Frank Mller M 25 189 125 Germany Bronze
1996 Richard Trautmann M 27 168 65 Germany Bronze
1996 Marko Spittka M 25 179 88 Germany Bronze
2000 Anna-Maria Gradante F 23 154 48 Germany Bronze
2004 Yvonne Bnisch F 23 168 61 Germany Gold
2004 Julia Matijass F 30 161 48 Germany Bronze
2004 Annett Bhm F 24 179 83 Germany Bronze
2004 Michael Jurack M 25 190 100 Germany Bronze
2008 Ole Bischof M 28 180 81 Germany Gold
2012 Kerstin Thiele F 25 168 70 Germany Silver
2012 Dimitri Peters M 28 188 100 Germany Bronze
2012 Ole Bischof M 32 180 81 Germany Silver
2012 Andreas Tlzer M 32 192 131 Germany Bronze
2016 Laura Vargas Koch F 26 173 70 Germany Bronze

To get more styling options, mainly for HTML table output, you can use kableExtra.

APA tables

For APA tables, I’ve found the rempsyc package which helps in building APA tables, but there are other options like flextable or gt as well:

#| label: tbl-judo
#| tbl-cap: Table with penguins species flipper length.

library(rempsyc)

nice_table(
  judo_athletes_ger
)
Table 1: German olympic medal winners in Judo.

Year

Name

Sex

Age

Height

Weight

Region

Medal

1,964

Wolfgang Hofmann

M

23

177

80.00

Germany

Silver

1,964

Klaus Glahn

M

22

187

101.00

Germany

Bronze

1,972

Paul Barth

M

26

181

90.00

Germany

Bronze

1,972

Klaus Glahn

M

30

187

101.00

Germany

Silver

1,972

Dietmar Htger

M

25

172

70.00

Germany

Bronze

1,976

Gnther Neureuther

M

20

186

95.00

Germany

Silver

1,980

Detlef Ultsch

M

24

170

80.00

Germany

Bronze

1,980

Dietmar Lorenz

M

30

180

93.00

Germany

Gold

1,980

Harald Heinke

M

25

178

78.00

Germany

Bronze

1,980

Dietmar Lorenz

M

30

180

93.00

Germany

Bronze

1,980

Karl-Heinz Lehmann

M

23

169

71.00

Germany

Bronze

1,984

Frank Wieneke

M

22

179

78.00

Germany

Gold

1,984

Arthur Schnabel

M

35

182

104.00

Germany

Bronze

1,984

Gnther Neureuther

M

28

186

95.00

Germany

Bronze

1,988

Frank Wieneke

M

26

179

78.00

Germany

Silver

1,988

Marcus "Marc" Meiling

M

26

194

95.00

Germany

Silver

1,988

Henry Sthr

M

28

194

120.00

Germany

Silver

1,988

Sven Loll

M

24

182

71.00

Germany

Silver

1,988

Torsten Brcht (Oehmigen-)

M

24

178

78.00

Germany

Bronze

1,992

Richard Trautmann

M

23

168

65.00

Germany

Bronze

1,992

Udo Gnther Quellmalz

M

25

175

65.00

Germany

Bronze

1,996

Johanna Hagn

F

23

168

Germany

Bronze

1,996

Udo Gnther Quellmalz

M

29

175

65.00

Germany

Gold

1,996

Frank Mller

M

25

189

125.00

Germany

Bronze

1,996

Richard Trautmann

M

27

168

65.00

Germany

Bronze

1,996

Marko Spittka

M

25

179

88.00

Germany

Bronze

2,000

Anna-Maria Gradante

F

23

154

48.00

Germany

Bronze

2,004

Yvonne Bnisch

F

23

168

61.00

Germany

Gold

2,004

Julia Matijass

F

30

161

48.00

Germany

Bronze

2,004

Annett Bhm

F

24

179

83.00

Germany

Bronze

2,004

Michael Jurack

M

25

190

100.00

Germany

Bronze

2,008

Ole Bischof

M

28

180

81.00

Germany

Gold

2,012

Kerstin Thiele

F

25

168

70.00

Germany

Silver

2,012

Dimitri Peters

M

28

188

100.00

Germany

Bronze

2,012

Ole Bischof

M

32

180

81.00

Germany

Silver

2,012

Andreas Tlzer

M

32

192

131.00

Germany

Bronze

2,016

Laura Vargas Koch

F

26

173

70.00

Germany

Bronze

Labels

Tables that are build programmatically can be labeled with #| label: tbl-judo at the top of the chunk. This will always put the correct number in the caption and also lets you cross-reference the table in your text by writing @tbl-judo Table 1.
The apaquarto template will take care of correctly rendering it to APA-style.
Captions can be written with #| tbl-cap: German olympic medal winners in Judo..

Formatting model output

There are some packages out there that help you to format output of statistical models. Let’s fit a simple logistic regression model to predict an athletes medal win by country (Germany or Japan) in Judo:

library(tidyverse)

athletes_judo <- readRDS(file = here::here("raw_data", "athletes.rds")) %>%
  mutate(Medal_bi = ifelse(is.na(Medal), 0, 1)) %>%
  filter(Sport == "Judo", Region %in% c("Germany", "Japan"))


model <- glm(Medal_bi ~ Region, family = binomial(link = "logit"), data = athletes_judo)

Normally, the output looks something like this:

summary(model)

Call:
glm(formula = Medal_bi ~ Region, family = binomial(link = "logit"), 
    data = athletes_judo)

Coefficients:
            Estimate Std. Error z value Pr(>|z|)    
(Intercept)  -0.9740     0.1930  -5.048 4.46e-07 ***
RegionJapan   1.5982     0.2671   5.983 2.19e-09 ***
---
Signif. codes:  0 '***' 0.001 '**' 0.01 '*' 0.05 '.' 0.1 ' ' 1

(Dispersion parameter for binomial family taken to be 1)

    Null deviance: 364.15  on 263  degrees of freedom
Residual deviance: 325.42  on 262  degrees of freedom
AIC: 329.42

Number of Fisher Scoring iterations: 4

Tidy up!

Now we have multiple options to easily extract the results of this regression. Most prominently, there is the broom package:

library(broom)

model_broom <- tidy(model)
model_broom
# A tibble: 2 × 5
  term        estimate std.error statistic       p.value
  <chr>          <dbl>     <dbl>     <dbl>         <dbl>
1 (Intercept)   -0.974     0.193     -5.05 0.000000446  
2 RegionJapan    1.60      0.267      5.98 0.00000000219

If we want to convert the estimates to Odds:

model_broom <- tidy(model, exponentiate = TRUE)
model_broom
# A tibble: 2 × 5
  term        estimate std.error statistic       p.value
  <chr>          <dbl>     <dbl>     <dbl>         <dbl>
1 (Intercept)    0.378     0.193     -5.05 0.000000446  
2 RegionJapan    4.94      0.267      5.98 0.00000000219

And if we want to extract the fit statistics:

glance(model)
# A tibble: 1 × 8
  null.deviance df.null logLik   AIC   BIC deviance df.residual  nobs
          <dbl>   <int>  <dbl> <dbl> <dbl>    <dbl>       <int> <int>
1          364.     263  -163.  329.  337.     325.         262   264
Tip

This works with many different model types, from t-tests over linear models to GLMs and multi level models and even lavaan output. They might be split out over multiple packages, multi level models for example can be tidied with broom.mixed.

Reporting

We can also let R write our report section for us ;):

library(report)

report(model)
We fitted a logistic model (estimated using ML) to predict Medal_bi with Region
(formula: Medal_bi ~ Region). The model's explanatory power is moderate (Tjur's
R2 = 0.14). The model's intercept, corresponding to Region = Germany, is at
-0.97 (95% CI [-1.36, -0.61], p < .001). Within this model:

  - The effect of Region [Japan] is statistically significant and positive (beta
= 1.60, 95% CI [1.08, 2.13], p < .001; Std. beta = 1.60, 95% CI [1.08, 2.13])

Standardized parameters were obtained by fitting the model on a standardized
version of the dataset. 95% Confidence Intervals (CIs) and p-values were
computed using a Wald z-distribution approximation.

If you want, take a look at report, it has many more functions to make the reporting workflow of your model a lot easier.

Automate in-text values

Even when not using report or some similar package, we can still extract the values automatically from a model and put them programmatically into the text. This can be achieved by simply adding an inline-codechunck into our markdown text:

The model’s intercept, corresponding to Region = Germany, is at 0.38.

Tip

Maybe put the data extraction into an own object to keep the text more readable:

model_intercept <- model_broom %>% filter(term == "(Intercept)") %>% pull(estimate) %>% round(2)

The model’s intercept, corresponding to Region = Germany, is at 0.38.

APA tables

For example with rempsyc:

library(rempsyc)

nice_table(model_broom, broom = "glm")

Term

estimate

SE

t

p

(Intercept)

0.38

0.19

-5.05

< .001***

RegionJapan

4.94

0.27

5.98

< .001***

Plots

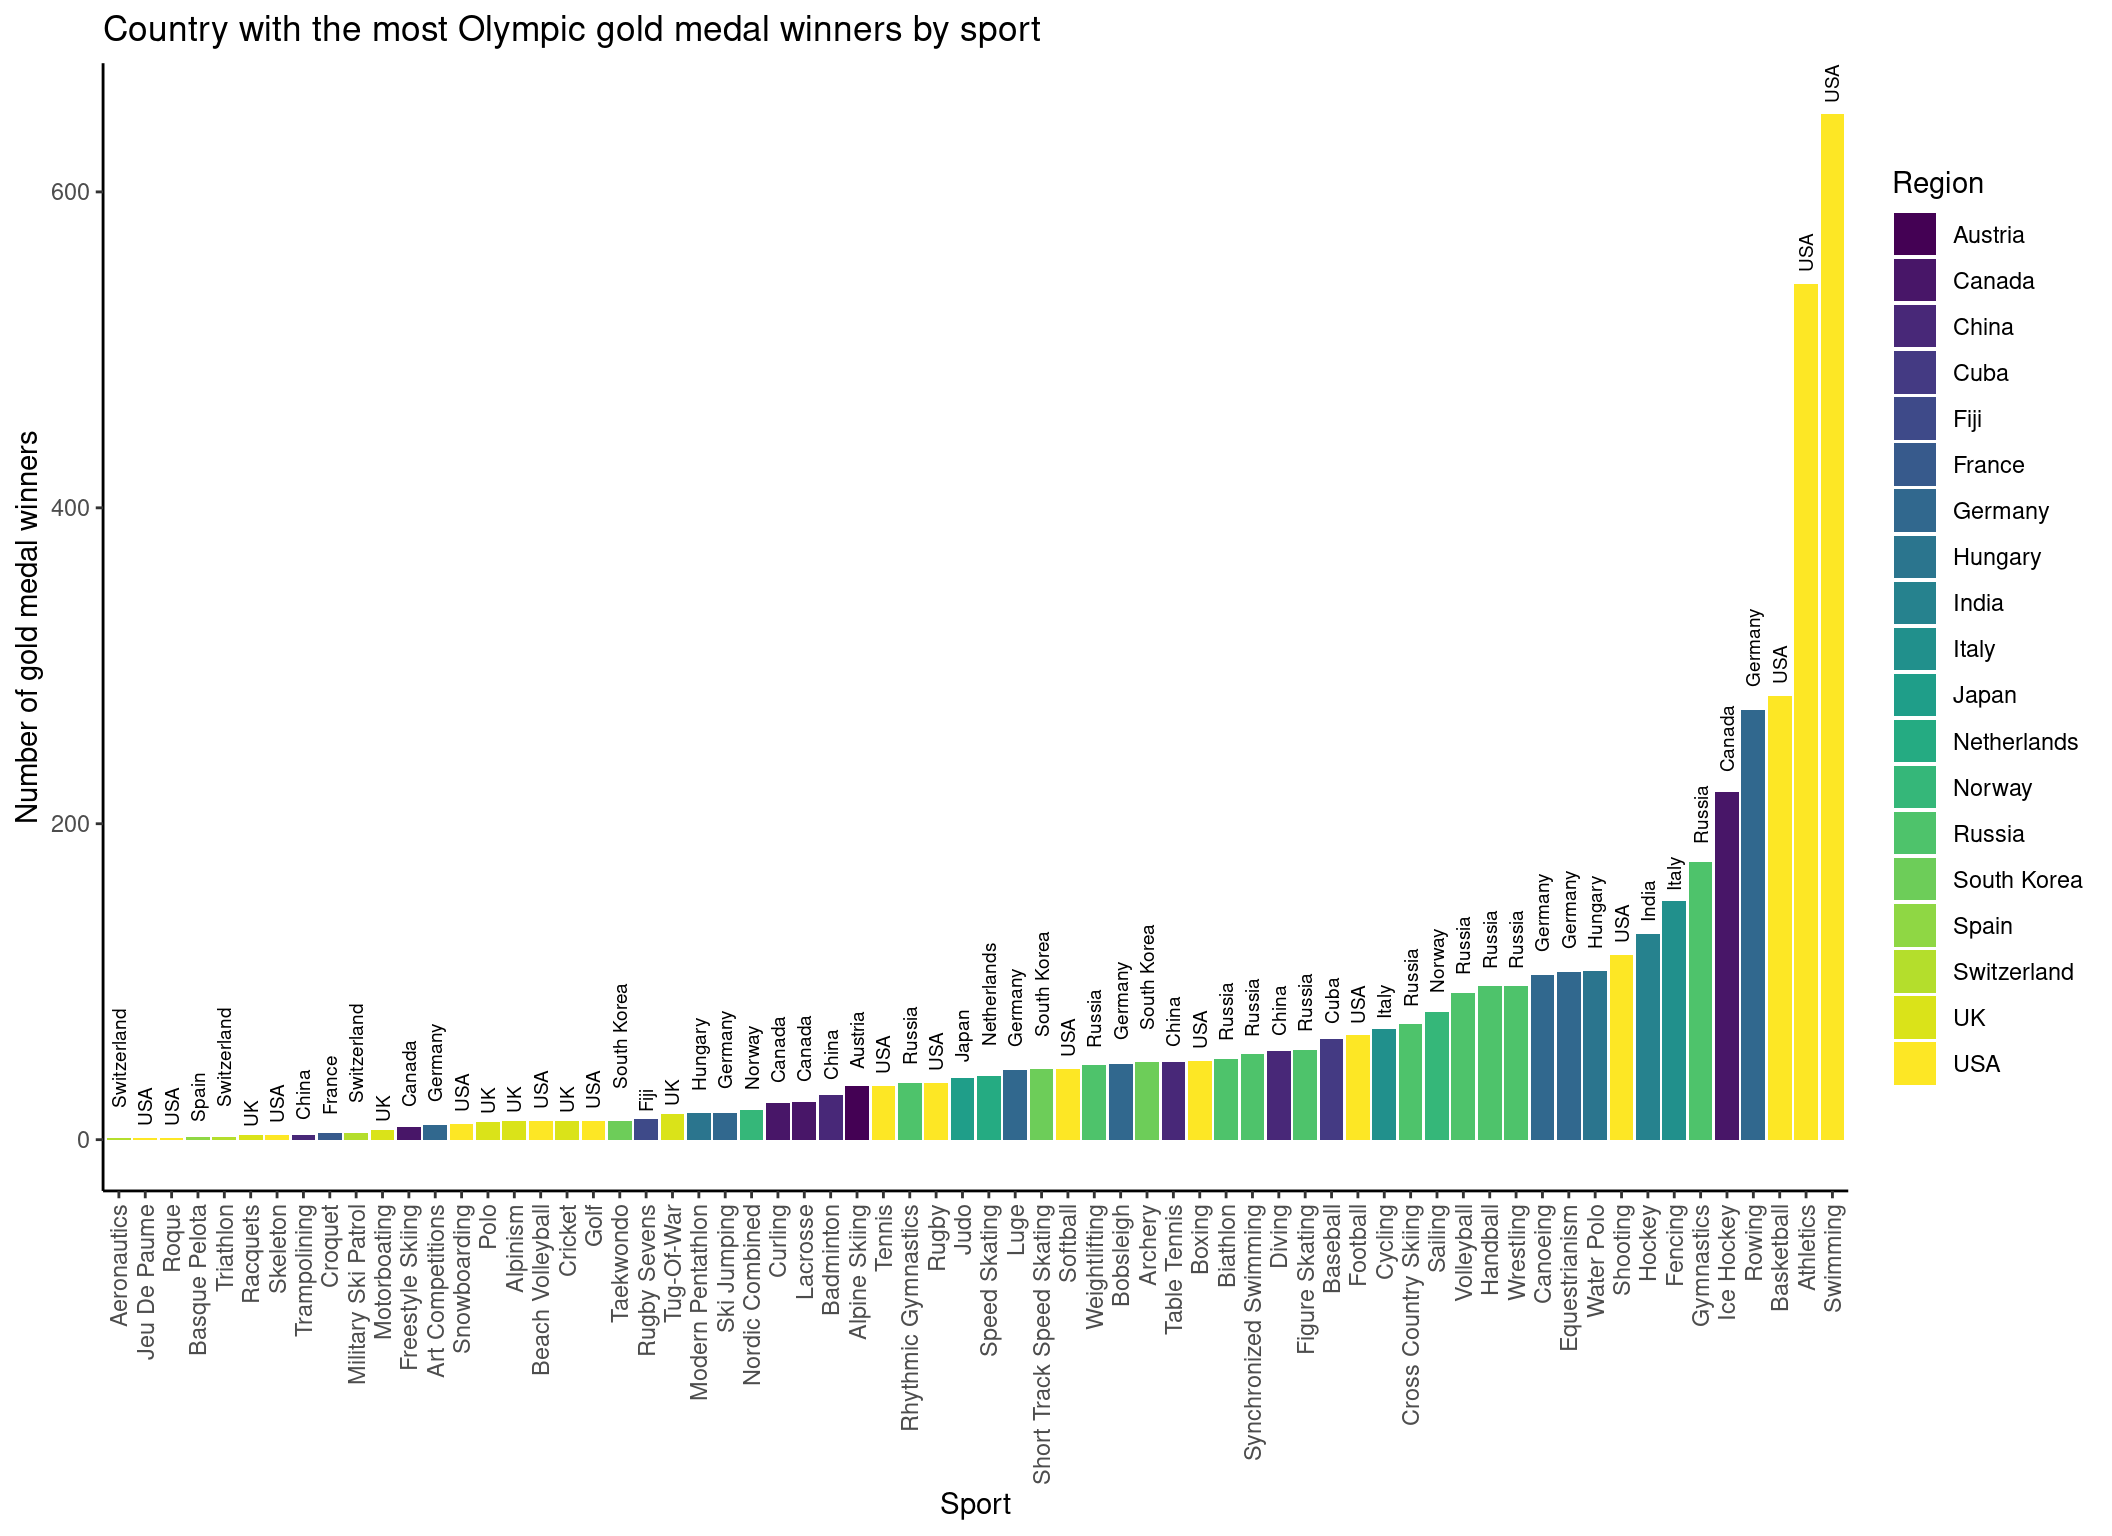
Plots can be very easily created from within a code chunk:

best_by_sport <- athletes %>%
  ## Get all gold medalists
  filter(Medal == "Gold") %>%
  ## Group them by sport and region
  group_by(Sport, Region) %>%
  ## count the number of medals each country has per sport category
  count(Medal) %>%
  ## Now only group by sport, so we can extract the maximum medal row by sport, and not by sport and country
  group_by(Sport) %>%
  ## Extract the country with the most medals
  slice(which.max(n))


p1 <- ggplot(
  data = best_by_sport,
  aes(
    x = Sport,
    y = n
  )
) +
  geom_col(aes(fill = Region, x = reorder(Sport, n))) +
  geom_text(aes(label = Region), hjust = -0.3, angle = 90, size = 2.5) +
  theme_classic() +
  ## And turn the axis labels again, because the new theme has overwritten our theme
  theme(axis.text.x = element_text(angle = 90, vjust = 0.5, hjust = 1)) +
  ## Specify which colors are used for the filling. They are from the package viridsLite, so you might need to install it.
  scale_fill_manual(values = viridisLite::viridis(19)) +
  ggtitle("Country with the most Olympic gold medal winners by sport") +
  xlab("Sport") +
  ylab("Number of gold medal winners")

Again, we can tweak the layout, captions etc. via the chunk options, see here for an overview.

#| fig-height: 8
#| fig-width: 11

p1

Citations

Citations are saved in .bib files. The .bib format can be chosen to download or copy on almost every website, often next to APA and others. It looks like this:

@article{allport1936trait,
  title={Trait-names: A psycho-lexical study.},
  author={Allport, Gordon W and Odbert, Henry S},
  journal={Psychological monographs},
  volume={47},
  number={1},
  pages={i},
  year={1936},
  publisher={Psychological Review Company}
}

@book{darwin1859,
  added-at = {2008-05-27T04:02:47.000+0200},
  address = {London},
  author = {Darwin, Charles},
  biburl = {https://www.bibsonomy.org/bibtex/2d70d713c717fb28384fb073c9f6dfbc2/neilernst},
  citeulike-article-id = {2376343},
  interhash = {c738acbb887362be5b0e6abc51be42d3},
  intrahash = {d70d713c717fb28384fb073c9f6dfbc2},
  keywords = {evolution},
  note = { or the Preservation of Favored Races in the Struggle for Life},
  priority = {2},
  publisher = {Murray},
  timestamp = {2008-05-27T04:02:47.000+0200},
  title = {On the Origin of Species by Means of Natural Selection},
  year = 1859
}

Of course, you should still check if the fields are filled in correctly. If you have created a references.bib file in your project directory, you can include it in your quarto document by adding bibliography: references.bib to your YAML header.
To cite a reference in you text, you can use an @ in front of the tag like @darwin1859 Darwin (1859) , or [@allport1936trait] (Allport & Odbert, 1936).

Referencing R packages

R packages are an important part of your analysis, and should be cited as such. The package grateful helps you with that.
To use it, put a grateful-refs.bib file into your YAML header:

---
title: "Reproducible manuscripts with Quarto"
description: "R-SIG 15.07.2024"
author: 
  - name: Nicklas Hafiz
  - affiliation: PhD student at the IQB, Methods team
categories: [R, quarto]
date: 07-15-2024
bibliography: 
  - references.bib
  - grateful-refs.bib
csl: apa7.csl
format: pdf
---

By using this list syntax, we can add multiple .bib-files to our quarto document. Then we only have to call the citation function in a code chunk:

grateful::cite_packages(output = "paragraph", out.dir = ".")

We used R version 4.4.2 (R Core Team, 2024) and the following R packages: flextable v. 0.9.6 (Gohel & Skintzos, 2024), here v. 1.0.1 (Müller, 2020), knitr v. 1.46 (Xie, 2014, 2015, 2024), rempsyc v. 0.1.8 (Thériault, 2023), report v. 0.5.8 (Makowski et al., 2023), rmarkdown v. 2.27 (Allaire et al., 2024; Xie et al., 2018, 2020), tidyverse v. 2.0.0 (Wickham et al., 2019), viridisLite v. 0.4.2 (Garnier et al., 2023).

Citation styles

Again, because we have our references in a plain text format, we can easily convert between different citation styles. One way to do this is to provide th csl argument in the YAML header, like so:

---
title: "Reproducible manuscripts with Quarto"
description: "R-SIG 15.07.2024"
author: 
  - name: Nicklas Hafiz
  - affiliation: PhD student at the IQB, Methods team
categories: [R, quarto]
date: 07-15-2024
bibliography: references.bib
csl: apa7.csl
format: pdf
---

.csl files can just be put into your project folder. They define the citation style, and can for example be downloaded from Zoteros style repository.

Reference section

The references will be automatically generated at the end of your document. Alternatively, you can include it where you want with

::: {#refs}
:::
Allaire, J., Xie, Y., Dervieux, C., McPherson, J., Luraschi, J., Ushey, K., Atkins, A., Wickham, H., Cheng, J., Chang, W., & Iannone, R. (2024). rmarkdown: Dynamic documents for r. https://github.com/rstudio/rmarkdown
Allport, G. W., & Odbert, H. S. (1936). Trait-names: A psycho-lexical study. Psychological Monographs, 47(1).
Darwin, C. (1859). On the origin of species by means of natural selection. Murray.
Garnier, Simon, Ross, Noam, Rudis, Robert, Camargo, Pedro, A., Sciaini, Marco, Scherer, & Cédric. (2023). viridis(Lite) - colorblind-friendly color maps for r. https://doi.org/10.5281/zenodo.4678327
Gohel, D., & Skintzos, P. (2024). flextable: Functions for tabular reporting. https://ardata-fr.github.io/flextable-book/
Makowski, D., Lüdecke, D., Patil, I., Thériault, R., Ben-Shachar, M. S., & Wiernik, B. M. (2023). Automated results reporting as a practical tool to improve reproducibility and methodological best practices adoption. CRAN. https://easystats.github.io/report/
Müller, K. (2020). here: A simpler way to find your files. https://here.r-lib.org/
R Core Team. (2024). R: A language and environment for statistical computing. R Foundation for Statistical Computing. https://www.R-project.org/
Thériault, R. (2023). rempsyc: Convenience functions for psychology. Journal of Open Source Software, 8(87), 5466. https://doi.org/10.21105/joss.05466
Wickham, H., Averick, M., Bryan, J., Chang, W., McGowan, L. D., François, R., Grolemund, G., Hayes, A., Henry, L., Hester, J., Kuhn, M., Pedersen, T. L., Miller, E., Bache, S. M., Müller, K., Ooms, J., Robinson, D., Seidel, D. P., Spinu, V., … Yutani, H. (2019). Welcome to the tidyverse. Journal of Open Source Software, 4(43), 1686. https://doi.org/10.21105/joss.01686
Xie, Y. (2014). knitr: A comprehensive tool for reproducible research in R. In V. Stodden, F. Leisch, & R. D. Peng (Eds.), Implementing reproducible computational research. Chapman; Hall/CRC.
Xie, Y. (2015). Dynamic documents with R and knitr (2nd ed.). Chapman; Hall/CRC. https://yihui.org/knitr/
Xie, Y. (2024). knitr: A general-purpose package for dynamic report generation in r. https://yihui.org/knitr/
Xie, Y., Allaire, J. J., & Grolemund, G. (2018). R markdown: The definitive guide. Chapman; Hall/CRC. https://bookdown.org/yihui/rmarkdown
Xie, Y., Dervieux, C., & Riederer, E. (2020). R markdown cookbook. Chapman; Hall/CRC. https://bookdown.org/yihui/rmarkdown-cookbook
Templates & APA

Own Templates

You can always create your own template Luckily, some people have done a lot of the work for us, and therefore we can use templates provided for specific journals. Oooor more generally, APA templates:

Papaja

There are some markdown templates that format your text in APA style. Most famously, the papaja package lets you write APA conform manuscripts. Sadly only in R Markdown, not in Quarto.

apaquarto

Alternatively, I’ve found (but not yet tested in a whole project) the apaquarto extension. You can install via the Terminal (not the R Console):

## Set the working directory
cd path/to/my/folder

## Use the Quarto Template
quarto use wjschne/apaquarto

Alternativley, you can also try to install via the R Console, however, it didn’t work for quite some people:

setwd("home/my_project") # Make sure the folder is empty
quarto::quarto_use_template("wjschne/apaquarto")

This will create the necessary files in your folder. Update the .qmd file with the same name as your folder. I’d suggest to also create a RStudio-project there, and maybe structure your files into multiple folders (data, R-Scripts …).
The template will label your tables and figures correctly, and format the bibliography as well as the whole document.
The tables can be build with the packages presented in the last chapter.

Word templates

If you want a word file as output (maybe some journal or co-author requires you to), you can do that easily by setting format: docx in your yaml header. If you don’t use a template like apaquarto, you can also style your own word template simply by changing the styles in a template word file and then load the template file into your quarto document with

format:
  docx:
    reference-doc: custom-reference-doc.docx

in the YAML header. Take a look at the official documentation for more detailled info.

Split your project

I recommend that you split up your project into many subfiles, that get merged in the end in a main document. In my opinion, this makes everything a lot easier to overview, because working with quarto makes it easy to just put everything from data preperation to reporting into one huge, confousing document. For example, you can put R-Functions into a own script and source it with source(functions.R). You can also put each chapter into a own .qmd file, and merge them together in a main document. Take a look at include for some input on how to do that.

Exercises

  1. Set up a new RStudio project in a new directory.
  2. Create an empty Quarto file.
  3. Fill it with a “mini-Analysis” of the characters and psych_stats data sets. You can use the code from the Plotting Exercise, for now not in APA style (we will do this next week). This Quarto file should contain:
  • A YAML header.
  • Invisible code chunks for data preparation (you will have to merge the characters and psych_stats data sets, take a look at Tip 1).
  • Some little text body (not important whats written there).
  • A little labeled table that also gets mentioned in the text body.
  • At least one plot that gets mentioned in the text body.
  • Own references.

Don’t spent too much time on what to write and on the code, you can just copy the code we wrote in the previous plotting exercises.

Prepare your data with:

# install.packages("tidyverse")
# install.packages("here")

library(tidyverse)
library(here)
here() starts at /home/runner/work/IQB-Methods/IQB-Methods
## Load the data
characters <- readRDS(file = here::here("raw_data", "characters.rds"))
psych_stats <- read.csv(
  file = here::here("raw_data", "psych_stats.csv"),
  sep = ";"
)

## Reshape into long format:
psych_stats <- psych_stats %>%
  pivot_longer(
    cols = messy_neat:innocent_jaded,
    names_to = "question",
    values_to = "rating"
  )

## Merge it
characters_stats <- merge(
  x = characters,
  y = psych_stats,
  by.x = "id",
  by.y = "char_id"
)
  1. Add a small “mini-analysis”, where you fit some kind of model and describe it in the text and/or in a table.

One idea would be a linear mixed model investigating the influence of the notability rating on the rating on a specific item, like messy_neat

library(lme4)
library(lmerTest) # for pvalues of fixed effects. 

mod_dat <- characters_stats %>%
  dplyr::filter(question == "messy_neat") %>%
  dplyr::group_by(uni_name) %>%
  ## center for interpretability:
  mutate(notability_uni_mean = mean(notability, na.rm = TRUE)) %>%
  mutate(notability_centered = notability - notability_uni_mean)

mod1 <- lmer(rating ~ notability_centered + (1|name) + (1|uni_name), data = mod_dat)
  1. Render your file into pdf, word and html.
  1. Create a fresh, empty folder for this exercise.
  2. Install the apaquarto template.
  • Make sure you have a current version of quarto installed. If not, download from here and install. Restart RStudio, it should find the new quarto installation automatically.

  • Make sure to set the working directory to an empty folder before installing:

setwd("home/my_project") # Make sure the folder is empty
quarto::quarto_use_template("wjschne/apaquarto")
  1. Create a RStudio project in your directory and open it.

  2. Repeat the analysis you’ve done in the previous exercise (just copy the code), but this time focus on the APA formating aspect of everything. Try to use as many features we’ve talked about before in your script, especially the automatic table and figure captions and numeration.

  3. Convert your manuscript into a word file and a PDF.

  1. Split up your document into multiple files. This is kind of a preference thing, however I find it easier to keep an overview if I split up my chapters and R code and don’t have a huge .qmd file containing everything. So try it! Create a folder called docs or something similar. It can contain files for functions, for data preperation etc, and can be loaded into your main script with source(). Create another folder called chapters where you put the .qmd files for the single chapters of your work. In the parent directory use a main .qmd file that brings everything together (either with source, or, in the case of other .qmd files, with {{< include _content.qmd >}} ).

Footnotes

  1. Image by Towfiqu barbhuiya on Unsplash.↩︎